Description
In this course, you will learn :
- How to decide which graph types to use in different situations, how to use Plotly for your own initiatives, and how to create your own interactive graphs. Plotly is a library for data visualisation.
- walks you through its key features and how to begin using it Plotly makes it simple to create charts and introduces you to basic charts, statistical charts, 3D plotting, mapping, and more.
- demonstrates how to add interactive dropdowns and buttons to charts and graphs, as well as how to create subplots and a dashboard to combine visualisations.
Syllabus :
1. Plotly Foundations
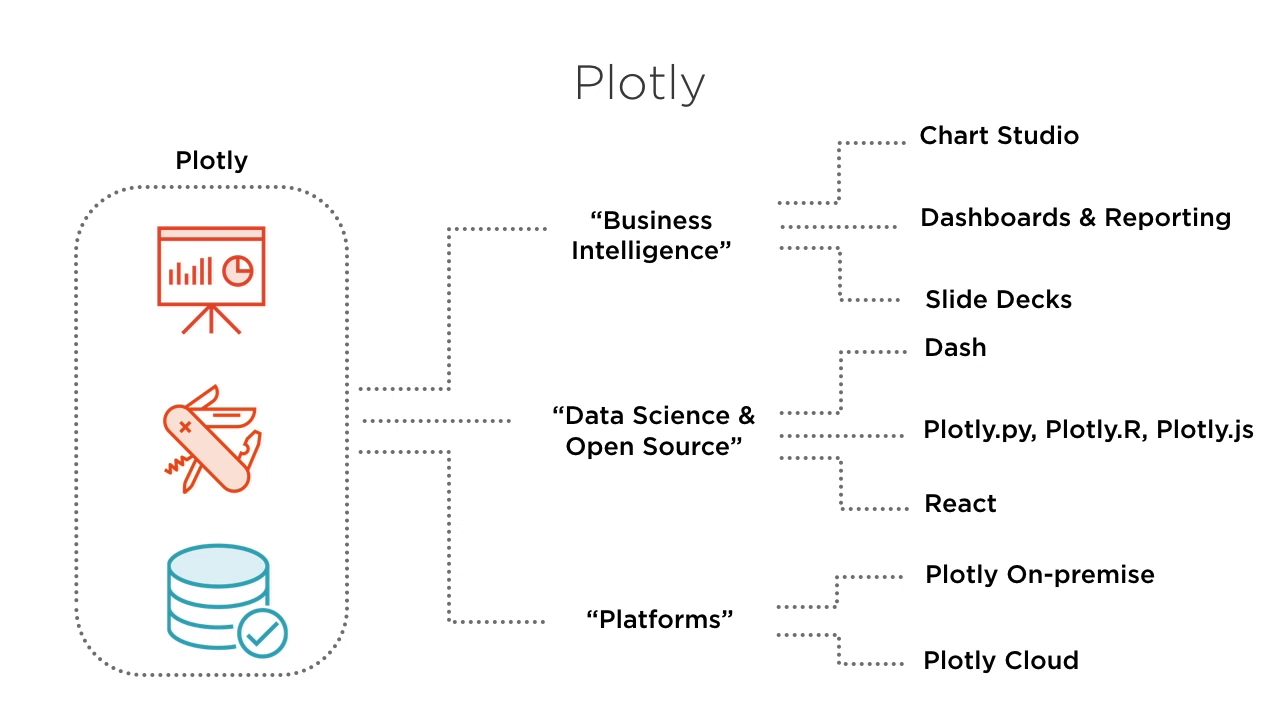
- What is Plotly?
- Getting started with Plotly
2. Usage Scenarios with Plotly
- Introduction to the figure in Plotly
- Plotly Express vs Go
- Making charts and sharing your work
3. Creating Visualizations with Plotly
- Basic charts with Plotly
- Statistical charts with Plotly
- 3D plotting with Plotly
- Mapping with Plotly
- Creating a sunburst graph
- Creating a sankey
4. Adding Interactivity with Plotly
- Creating dropdowns and buttons
- Creating subplots
- Creating dashboards with Dash


