Description
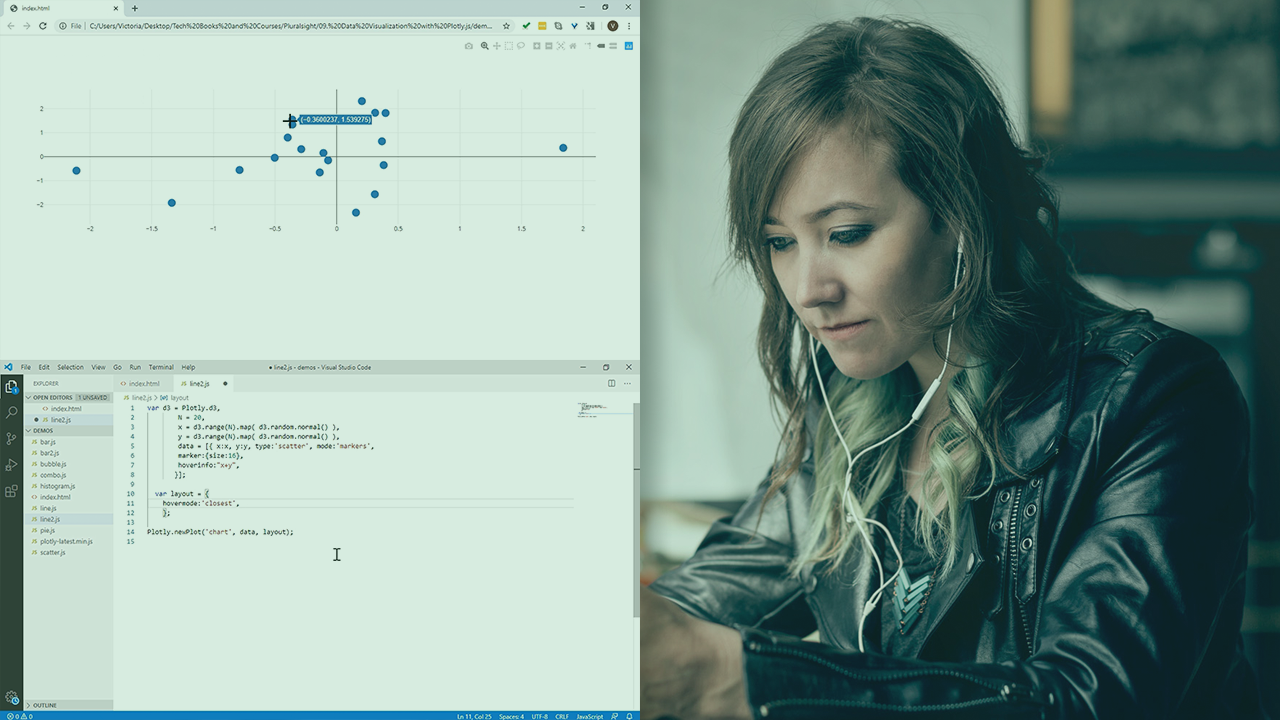
First, you'll explore the basic requirements to use Plotly.js and build basic graphs with the starter set of formatting and customization options.
Next, you'll discover more advanced features and customization and formatting options, such as annotations, legends, and subplots.
Finally, you'll learn how to build on these skills and create more advanced charts with specific examples, such as scientific, financial, and statistical charts.


