 Share
Share Description
In this course, you will :
- Learn how to create time series models with trend or seasonality.
- Investigate models such as ARIMA, exponential smoothing, and neural networks in greater depth.
- Learn how to use dygraphs to interactively visualise time series.
- When you complete this course, you will be able to apply standard time series models to a univariate time series.
Syllabus :
1. Using R for Time Series Analysis
- Course Roadmap
- Common Functions for Time Series Analysis
2. Modeling Unemployment Rates
- Working with Trending Data
- The Project Dataset
- Exponential Smoothing for Trending Data
- Holt Trend Model with Damping Parameter
- ARIMA for Trending Data
- Time Series Model Comparison Plots
3. Forecasting Inflation Rates
- Working with Seasonality
- The Project Dataset
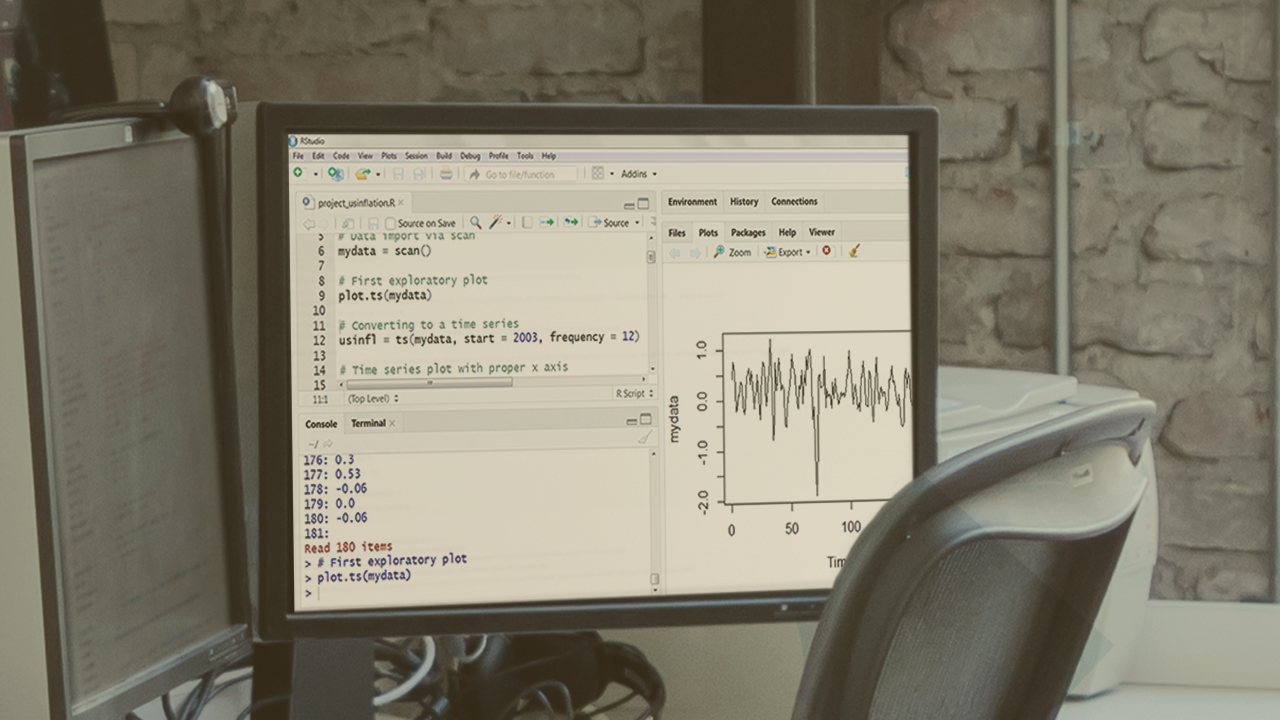
- Data Import
- Seasonal Decomposition
- ARIMA for Seasonal Data
- Exponential Smoothing for Seasonal Data
4. Predicting Sales Using Neural Networks
- The Project Dataset
- Getting the Data Ready
- Neural Networks for Time Series
- Interactive Charts with Dygraphs