Description
First, you'll learn the very basics of plotting with pandas, learning how to prepare your dataset for plotting, and how to create common plots like a bar, line, and scatter plot.
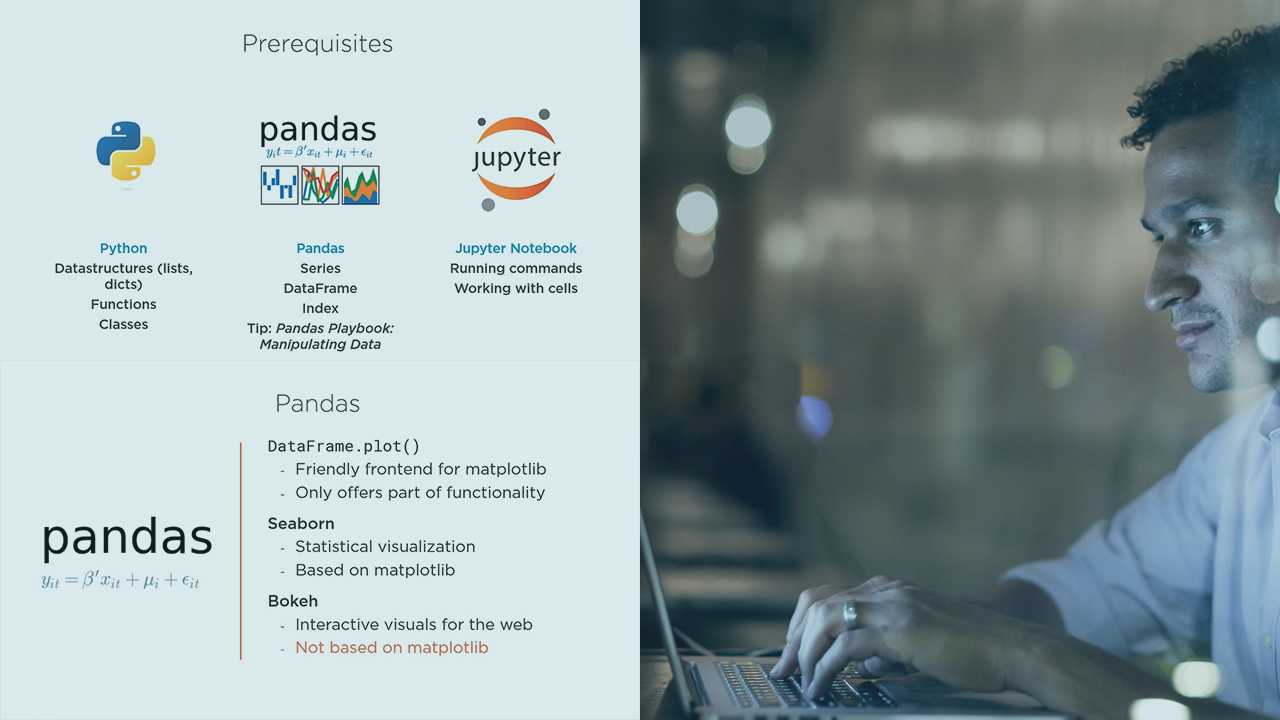
Next, you will explore matplotlib, the Python library that generates the actual graphics, how this interacts with Pandas, and how to use it correctly. Then, you will go more in-depth and learn about all the ways to customize your plots, including line styles, colors and themes, customizing axes and legends, creating interactive plots, and much more.
Finally, you will see a short overview of two other visualization libraries that can be used with Pandas:


