Description
In this course, you will :
- Learn how to use Power BI's Data, Model, and Report views and how to navigate this user-friendly tool.
- In the Data view, you'll load multiple datasets, in the Model view, you'll create a data model to understand the relationships between your tables, and in the Report view, you'll create your first bar graph and interactive map visualisation.
- Learn how to change and format a variety of visualisations before progressing to sorting data and creating hierarchies, which will allow you to drill into your reports.
- Learn how to filter information in your reports based on location and how to control how these filters interconnect and interact with other visuals in your report.
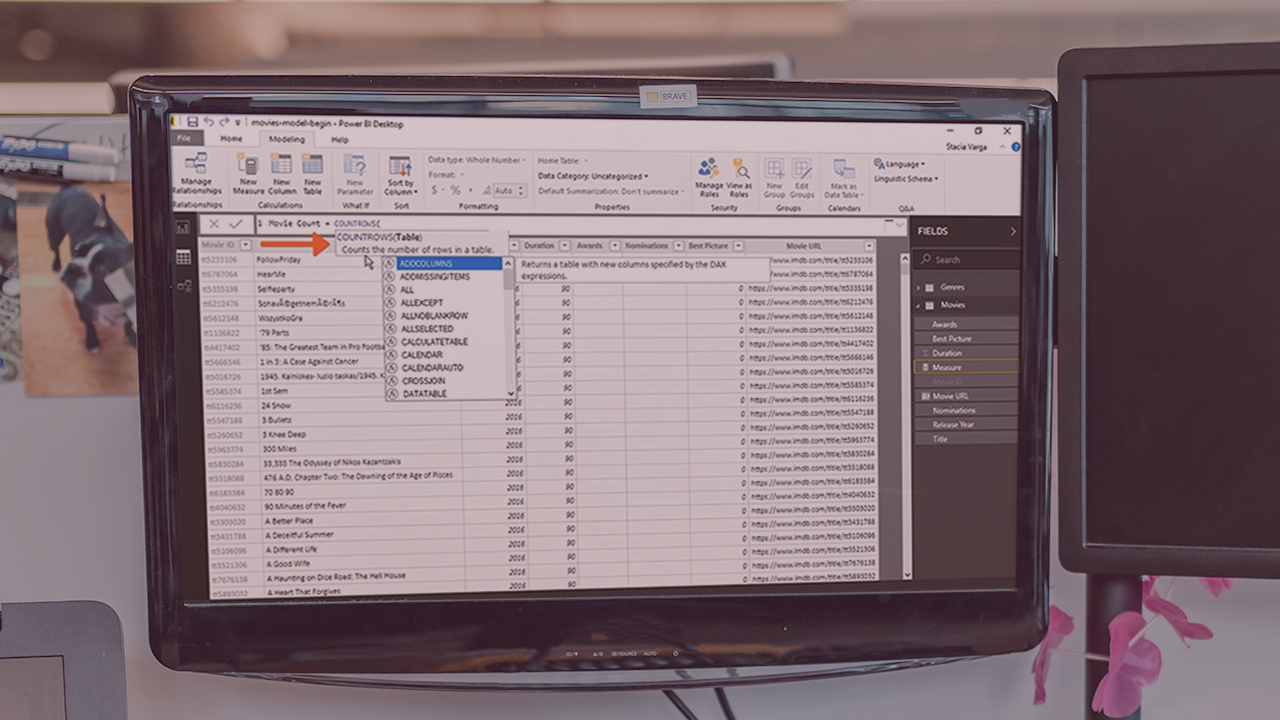
- Learn how to use DAX, Microsoft's formula language, to create customised calculations (Data Analysis Expressions).
- You'll learn how to write formulas in Excel, as well as how to create calculated columns and tables—and when to use them.
Syllabus :
- Getting Started with Power BI
- Visualizing Data
- Creating Calculations with DAX


