Description
In this course, you will :
- Learn how to efficiently handle, analyze, and visualize data with Python and its sophisticated libraries, including Pandas, NumPy, Matplotlib, and Seaborn.
- Acquire the ability to retrieve, alter, and aggregate data with SQL. You will use SQL Server to handle complex databases and run advanced queries.
- Learn how to use EDA to find insights, spot patterns, and prepare data for future analysis using excellent data visualization.
- Learn how to use Power BI to create engaging and intelligent dashboards, how to do sophisticated calculations using DAX, and how to integrate real-world data into reports.
Syllabus:
- Complete Python With Important Libraries
- Data Analysis With Python
- Getting Started With Statistics
- Descriptive Statistics
- Probability Distribution Function And Types OF Distribution
- Inferential Stats And Hypothesis Testing
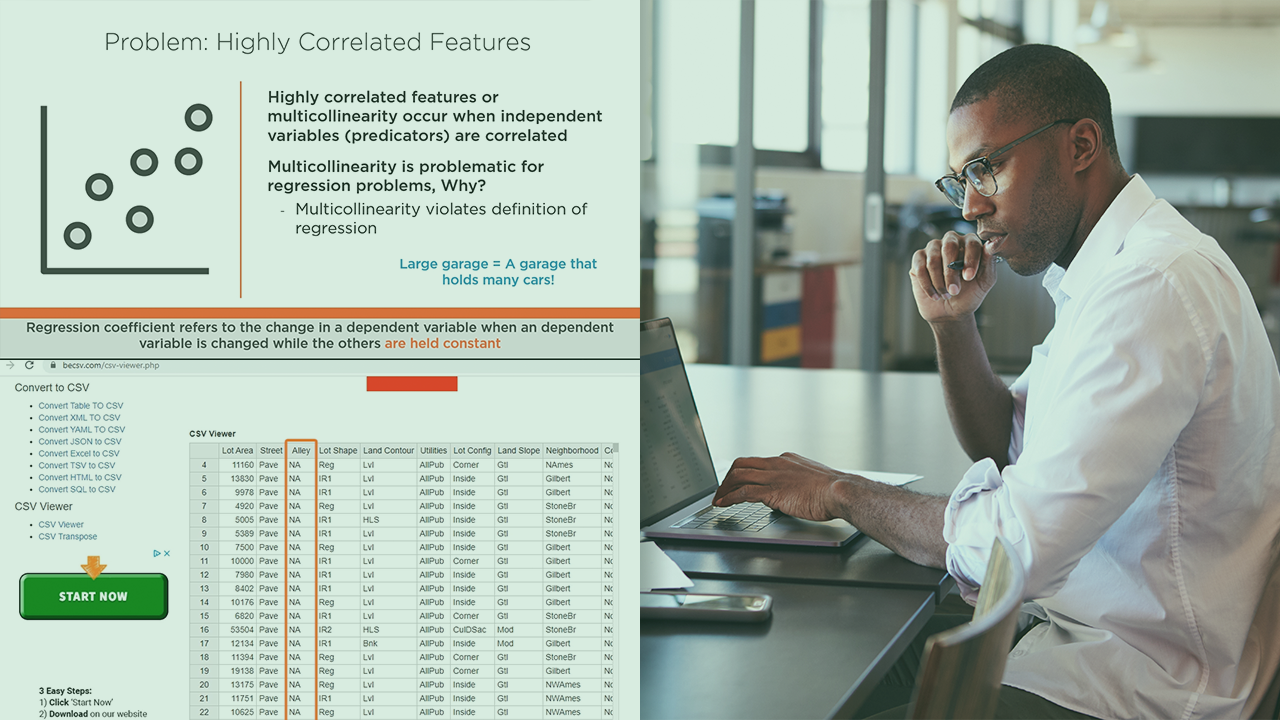
- Feature Engineering With Python
- Exploratory Data Analysis
- SQL : Course Introduction & Overview
- Microsoft SQL Server basics
- SQL Basics Questions
- SQL Assignments
- SQL Functions
- Advanced SQL
- SQL Important Interview Questions
- Power BI Course Introduction
- Introduction to Power BI
- Data Visualization
- Power Query Editor
- DAX
- Power BI Project 1, Sales Data Analysis
- Power BI Project 2, Insurance Data Analysis
- Power BI Project 3, UPI Transactions Data Analysis
- Miscellaneous Section Power BI
- Getting Started with Microsoft Excel
- Excel Dashboard
- Power Query Editor (MS Excel)
- Excel Activity (Importing Data From SQL Server)
- Tableau
- Tableau Dashboard
- Tableau Prep Builder
- SQL + Tableau Project (Student Depression Data Analysis)
- Snowflake
- Connecting Snowflake to Power BI & Tableau
- AWS + Snowflake + Power BI Project
- AWS + Snowflake + Tableau Project