15 Best Data Visualization Courses & Certifications online
Highly curated the best Data Visualization certification for beginners. Start with the top Data Visualization courses and learn about Data Visualization as beginners.

The best Data Visualization course online & Training to Learn the Best Data Visualization tutorials for beginners to advanced levels.
Best Data visualization course online is a general term that describes any effort to help people understand the significance of data by placing it in a visual context. Patterns, trends, and correlations that might go undetected in text-based data can be exposed and recognized easier with data visualization software.
Disclosure: Coursesity is supported by the learners community. We may earn an affiliate commission when you make a purchase via links on Coursesity.
Best Data Visualization Course Online and Trainings
- Learning Python for Data Analysis and Visualization
- Data Visualization with Tableau
- Free Online Data Visualization Course
- Learn Data Visualization in D3.js (D3 Library Intro Course)
- Data Visualization on the Browser with Python and Bokeh
- Data Visualization with Python
- Data Visualization and Communication with Tableau
- Data Visualization
- Craft Impactful Narratives with Data
- Data Visualization Courses
- Learning Data Visualization Online Class
- Data Visualization Online Courses
- Data Visualization Online Courses
- Big Data: Data Visualisation - Online Course
- How to Process, Analyze and Visualize Data
1. Learning Python for Data Analysis and Visualization
Learn python and how to use it to analyze, visualize and present data. Includes tons of sample code and hours of video.
- Course rating: 4.3 out of 5.0 (18,518 Ratings total)
- Duration: 21 Hours
- Certificate: Certificate of completion
With this Best Data Visualization course online, you will:
- Have an intermediate skill level in Python programming.
- Use the Jupyter Notebook Environment.
- Use the NumPy library to create and manipulate arrays.
- Use the panda's module with Python to create and structure data.
- Learn how to work with various data formats within python, including JSON, HTML, and MS Excel Worksheets.
- Create data visualizations using matplotlib and the seaborn modules with python.
- Have a portfolio of various data analysis projects.
This Best Data Visualization course online will give you the resources to learn python and effectively use it to analyze and Data Visualization course. You'll get a full understanding of how to program with Python and how to use it in conjunction with scientific computing modules and libraries to analyze data. You will also get lifetime access to over 100 example python code notebooks, new and updated videos, as well as future additions of various data analysis projects that you can use for a portfolio to show future employers.
You can take Learning Python for Data Analysis and Visualization Certificate Course on Udemy.

2. Data Visualization with Tableau
Learn the Best Data Visualization Course Online with Tableau from the University of California, Davis. In 2020 the world will generate 50 times the amount of data as in 2011. And 75 times the number of information sources (IDC, 2011). Being able to use this data provides.
- Course rating: 4.6 out of 5.0 (8,569 Ratings total)
- Duration: 72 Hours
- Certificate: Certificate of completion
With this best Data Visualization course online, you will:
- Examine, navigate, and learn to use the various features of Tableau
- Assess the quality of the data and perform exploratory analysis
- Create and design visualizations and dashboards for your intended audience
- Combine the data and follow the best practices to present your story
This Data Visualization course Specialization, in collaboration with Tableau, is intended for newcomers to data visualization with no prior experience using Tableau. We leverage Tableau's library of resources to demonstrate best practices for data visualization and data storytelling.
You will view examples from real-world business cases and journalistic examples from leading media companies. By the end of this specialization, you will be able to generate powerful reports and dashboards that will help people make decisions and take action based on their business data. You will use Tableau to create high-impact visualizations of common data analyses to help you see and understand your data. You will apply predictive analytics to improve business decision-making.
This Data Visualization course Specialization culminates in a Capstone Project in which you will use sample data to create visualizations, dashboards, and data models to prepare a presentation to the executive leadership of a fictional company.
You can take the Data Visualization course with Tableau Certificate Course on Coursera.


3. Free Online Data Visualization Course
Learn about exploring your data & applying visualizations to display your data. You will learn about feature engineering & constructing machine learning models.
Course rating: 3.8 out of 5.0 ( 4,953 Ratings total)
In this course, you will:
- discuss the importance of data exploration.
- recognize what you use for data visualizations in R.
- recognize what you use for data visualizations in Python.
- identify the different types of plots or charts you can use to visualize your data.
- discuss the process of feature engineering data.
- identify features and methods available in R for creating Machine learning models.
- identify features and methods available in Python for creating Machine learning models.
- outline the process and options for evaluating your machine-learning model.
The course includes:
- Data Exploration and Visualization - Learning Outcomes
- Exploratory data analysis
- Data visualization with R
- Data Exploration and Visualization Lesson - Summary
- Building Models in Azure ML
- Building Models in Azure ML Learning - Outcomes
- Feature Engineering Creating and Scoring Models
- Modeling in R
- Modeling in Python
- Model Evaluation and Comparison
- Building Models in Azure ML - Lesson Summary
This Data Visualization course teaches you about visualizing data and exploring models. Data visualization is a highly useful way to explore data and can help you determine relationships between columns.
Learn about data science techniques, applying visualizations to display data, and feature engineering methods.
With this course, you will learn how to apply visualizations to display your data and about feature engineering and constructing machine learning models. You will learn how to evaluate your model in Azure ML, R, Python, and more!
You can take Free Online Data Visualization Course Certificate Course on Alison.

4.Learn Data Visualization in D3.js (D3 Library Intro Course)
Design and build beautiful data visualizations with d3.js. An intensive introduction to the D3 library.
- Course rating: 4.5 out of 5.0 (4,745 Ratings total)
- Duration: 6.5 Hours
- Certificate: Certificate of completion
With this Data Visualization course, you will:
- Understand the fundamental building blocks of D3
- Gain a wide breadth of knowledge, learning how to create 14 different visualizations
- Critique existing visualizations and invent better designs for displaying data
- Interpret open-source code from the D3 community for use in your own projects
- Master advanced tools in D3, building choropleth maps, brushes, tooltips, and layouts
- Develop substantial web apps, with multiple visualizations on the page at once
- Articulate original abstract ideas with compelling sketches
This Data Visualization course will take you from a beginner level in D3 to the point where you can build virtually any visualization that you can imagine. The course will teach you to program in the latest version of D3 - version 5.x. Course Outline In the first phase of the course, we will be building up your knowledge of D3 and introducing you to some of the most foundational topics in data visualization.
You will: Understand what SVGs are and how they work with D3. Discover how D3 associates shape with pieces of data. Write scales, axes, and labels to make some basic visualizations. Use the D3 update pattern to shift the position of SVGs as our data changes. Handle user interactions by adding events to the page. Add legends, tooltips, and sliders to your visualizations.
The Data Visualization course will also focus on data visualization design, helping you to make better decisions about how to structure your code, and teaching you to justify the decisions that you make to others. You will learn how to select the right visual channels for the data that you're working with to create completely unique visualizations.
You can take Learn Data Visualization course in D3.js (D3 Library Intro Course) Certificate Course on Udemy.

5. Data Visualization on the Browser with Python and Bokeh
A complete guide on creating beautiful plots and data dashboards on the browser using the Python Bokeh library.
- Course rating: 4.1 out of 5.0 (959 Ratings total)
- Duration: 6.5 Hours
- Certificate: Certificate of completion
With this Data Visualization course, you will:
- Build advanced data visualization course web apps using the Python Bokeh library.
- Create interactive modern web plots that represent your data impressively.
- Create widgets that let users interact with your plots.
- Learn all the available Bokeh styling features.
- Integrate and visualize data from Pandas DataFrames.
- Create dynamic graphs that plot real-time data.
- Plot time-series data.
- Integrate your data visualization course apps with Flask apps.
- Deploy the apps in live servers.
- Learn how to troubleshoot Bokeh apps.
This Data Visualization course is a complete guide to mastering Bokeh which is a Python library for building advanced and modern data visualization web applications.
The Data Visualization course will guide you step by step starting from plotting simple datasets to building rich and beautiful data visualization web apps that plot data in real-time and allow web users to interact and change the behavior of your plots via the internet from their browsers.
Bokeh is a brand new data science library that is gaining traction fast so it's smart to be ahead of the competition and pack the skills in your portfolio. Whether you are a data analyst, data scientist, statistician or any other specialist in the data industry this course is perfect for you as it will give you the skills to visualize data in a way that excites your audience and eventually sells your product or your idea much easier.
All you need to have to learn Bokeh is some basic prior knowledge of Python. The course also contains exercises to help you check your skills as you progress. You will be given access to various data samples and will be provided with additional examples to enforce your Bokeh skills.
The Data Visualization course is estimated to take you around four weeks to complete assuming you devote 10-20 hours/week depending on your productivity skills. You also get daily instructor support in the student forum inside the course which guarantees your success. Who this course is for: Anyone involved in the data industry Anyone who is already familiar with Python basics
You can take a Data Visualization course on the Browser with Python and Bokeh Certificate Course on Udemy.

6. Data Visualization with Python
Learn Data Visualization with Python from IBM. "A picture is worth a thousand words". We are all familiar with this expression. It especially applies when trying to explain the insight obtained from the analysis of increasingly large datasets.
- Course rating: 4.5 out of 5.0 (8,519 Ratings total)
- Duration: 18 Hours
- Certificate: Certificate of completion
Data visualization course plays an essential role in the representation of both small and large-scale data. One of the key skills of a data scientist is the ability to tell a compelling story, visualizing data and findings in an approachable and stimulating way.
Learning how to leverage a software tool to visualize data will also enable you to extract information, better understand the data, and make more effective decisions.
The main goal of this Data Visualization course with Python course is to teach you how to take data that at first glance has little meaning and present that data in a form that makes sense to people. Various techniques have been developed for presenting data visually but in this course, we will be using several data visualization libraries in Python, namely Matplotlib, Seaborn, and Folium.
In this Data Visualization course, you will learn about data visualization and some of the best practices to keep in mind when creating plots and visuals. You will also learn about the history and the architecture of Matplotlib and learn about basic plotting with Matplotlib. In addition, you will learn about the dataset on immigration to Canada, which will be used extensively throughout the course.
Finally, you will briefly learn how to read CSV files into a pandas data frame and process and manipulate the data in the data frame, and how generate line plots using Matplotlib.
You can take the Data Visualization course with Python Certificate Course on Udemy.

7. Data Visualization and Communication with Tableau
Learn Data Visualization and Communication with Tableau from Duke University. One of the skills that characterize great business data analysts is the ability to communicate the practical implications of quantitative analyses to any kind of audience.
- Course rating: 4.7 out of 5.0 (2,775 Ratings total)
- Duration: 25 Hours
- Certificate: Certificate of completion
With this Data Visualization course, you will:
- Craft the right questions to ensure your analysis projects succeed;
- Leverage questions to design logical and structured analysis plans;
- Create the most important graphs used in business analysis and transform data in Tableau;
- Design business dashboards with Tableau;
- Tell stories with data;
- Design effective slide presentations to showcase your data story; and
- Deliver compelling business presentations.
One of the skills that characterize great business data analysts is the ability to communicate the practical implications of quantitative analyses to any kind of audience member.
Even the most sophisticated statistical analyses are not useful to a business if they do not lead to actionable advice, or if the answers to those business questions are not conveyed in a way that non-technical people can understand. In this course, you will learn how to become a master at communicating business-relevant implications of data analyses.
By the end, you will know how to structure your data analysis projects to ensure the fruits of your hard labor yield results for your stakeholders. You will also know how to streamline your analyses and highlight their implications efficiently using visualizations in Tableau, the most popular visualization program in the business world.
Using other Tableau features, you will be able to make effective visualizations that harness the human brain’s innate perceptual and cognitive tendencies to convey conclusions directly and clearly. Finally, you will be practiced in designing and persuasively presenting business “data stories” that use these visualizations, capitalizing on business-tested methods and design principles.
By the end of this Data Visualization course, you will know how to structure your data analysis projects to ensure the fruits of your hard labor yield results for your stakeholders. You will also know how to streamline your analyses and highlight their implications efficiently using visualizations in Tableau, the most popular visualization program in the business world.
Using other Tableau features, you will be able to make effective visualizations that harness the human brain’s innate perceptual and cognitive tendencies to convey conclusions directly and clearly. Finally, you will be practiced in designing and persuasively presenting business “data stories” that use these visualizations, capitalizing on business-tested methods and design principles by completing a final peer-assessed project recommending a business process change.
You can take the Data Visualization course and the Communication with Tableau Certificate Course on Coursera.

8. Data Visualization
Learn Data visualization course from the University of Illinois at Urbana-Champaign. Learn the general concepts of data mining along with basic methodologies and applications. Then dive into one subfield in data mining: pattern discovery. Learn in-depth.
- Course rating: 4.5 out of 5.0 (1,108 Ratings total)
- Duration: 15 Hours
- Certificate: Certificate of completion
This Data Visualization course provides you the opportunity to learn skills and content to practice and engage in scalable pattern discovery methods on massive transactional data, discuss pattern evaluation measures, and study methods for mining diverse kinds of patterns, sequential patterns, and sub-graph patterns.
You will become familiar with the course, your classmates, and our learning environment. The orientation will also help you obtain the technical skills required for the course. In this week's module, you will learn what data visualization is, how it's used, and how computers display information.
You'll also explore different types of data visualization courses and how humans perceive information. In this week's module, you will start to think about how to visualize data effectively.
This will include assigning data to appropriate chart elements, using glyphs, parallel coordinates, and streamgraphs, as well as implementing principles of design and color to make your visualizations more engaging and effective. In this week's module, you will learn how to visualize graphs that depict relationships between data items.
You'll also plot data using coordinates that are not specifically provided by the data set. In this week's module, you will start to put together everything you've learned by designing your own visualization system for large datasets and dashboards. You'll create and interpret the visualization you created from your data set, and you'll also apply techniques from user-interface design to create an effective visualization system.
You can take Data Visualization Certificate Course on Coursera.

9. Craft Impactful Narratives with Data
You’ll start by building data visualizations and dashboards, considering your audience to be as effective as possible.
- Course rating: 4.7 out of 5.0 (150 Ratings total)
- Duration: 160 Hours
- Certificate: Certificate of completion
With this data visualization course, you will:
- Learn how to select the most appropriate data visualization for analysis, evaluate the effectiveness of data visualization, and build interactive and engaging Tableau dashboards.
- Design and create a dashboard in an enterprise environment. Discover user needs, identify key metrics, and tailor your dashboard to a particular audience.
- Learn the end-to-end process for telling a story and providing a recommendation based on data. You'll define an effective problem statement, structure a data presentation, scope analyses, identify biases and limitations within your dataset, and pull together an end-to-end analysis.
- Learn advanced data visualization and storytelling techniques. Learn to use Tableau Story point to add interactivity and other visual elements to a story, and add animation and narration with Tableau Pages and Flourish.
Later, you’ll move into drafting presentations using storytelling techniques, visualizations, and animations to provide data-driven recommendations.
You can take Craft Impactful Narratives with Data Certificate Course on Udacity.

10. Data Visualization Courses
Machine learning is the science of getting computers to act without being explicitly programmed. In the past decade, machine learning has given us self-driving cars, practical speech recognition, effective web search, and a vastly improved understanding of the human genome.
Machine learning is so pervasive today that you probably use it dozens of times a day without knowing it. Many researchers also think it is the best way to make progress toward human-level AI.
In this Data Visualization course, you will learn about the most effective machine learning techniques, and gain practice implementing them and getting them to work for yourself. More importantly, you'll learn about not only the theoretical underpinnings of learning but also gain the practical know-how needed to quickly and powerfully apply these techniques to new problems.
Finally, you'll learn about some of Silicon Valley's best practices in innovation as it pertains to machine learning and AI.
You can take this Data Visualization Courses Certificate Course on Coursera.

11. Learning Data Visualization Online Class
Communicate complex ideas quickly and thoroughly with data visualization. Turn information into artwork and intrigue your audience.
- Course rating: 4,311 total enrollments
- Duration : 3 h 49 m
- Certificate: Certificate on completion
In this course, you will :
- Describe the process of incorporating people's interests into data visualizations.
- Distinguish how the Ws are used in data visualization.
- Describe the techniques used to define your narrative when visualizing data.
- Determine the factors that make data visualizations relevant to the interests and needs of an audience.
- Examine the proper use of charts in data visualizations.
- Define the process of incorporating interactivity into data visualizations.
This Data Visualization course shows how to understand your data and your audience, craft the story you need to tell, and determine the best visual model and details to use for that story.
You can take the Learning Data Visualization Online Class certification course on Linkedin Learning.


12. Data Visualization Online Courses
Get the training you need to stay ahead with expert-led courses on Data Visualization course.
With this Data Visualization course, you will:
- Managing data sources and visualizations
- Managing Tableau worksheets and workbooks
- Displaying source metadata
- Creating custom calculations and fields
- Analyzing data using statistical tools
- Sorting and filtering Tableau data
- Defining groups and sets
- Creating and pivoting crosstabs
- Formatting Tableau visualizations
- Creating basic charts
- Annotating and formatting charts
- Mapping geographic data
- Creating dashboards
- Methods for defining an URL-based action
Tableau is a widely used data analytics and visualization tool that many consider indispensable for data-science-related work. Its drag-and-drop interface makes it easy to sort, compare, and analyze data from multiple sources, including Excel, SQL Server, and cloud-based data repositories.
In this Data Visualization course, learn what you need to know to analyze and display data using Tableau Desktop 2019—and make better, more data-driven decisions for your company. Discover how to install Tableau, connect to data sources, and sort and filter your data. Instructor Curt Frye also demonstrates how to create and manipulate data visualizations—including highlight tables, charts, scatter plots, histograms, maps, and dashboards—and shows how to share your visualizations.
You can take Data Visualization Online Courses on LinkedIn.

13. Visualizing Data with Python
Data visualization course is the graphical representation of data in order to interactively and efficiently convey insights to clients, customers, and stakeholders in general.
- Course rating: 44,175 total enrollments
- Duration: 15 Hours
- Certificate: Certificate of completion
With this Data Visualization course, you will:
- how to take data that at first glance has little meaning and present that data in a form that makes sense to people.
- how to use some data visualization libraries in Python, namely Matplotlib, Seaborn, and Folium for presenting data.
"A picture is worth a thousand words". We are all familiar with this expression. It especially applies when trying to explain the insights obtained from the analysis of increasingly large datasets. Data visualization course plays an essential role in the representation of both small and large-scale data.
One of the key skills of a data scientist is the ability to tell a compelling story, visualizing data and findings in an approachable and stimulating way.
In this Data Visualization course, you will learn how to leverage a software tool to visualize data that will also enable you to extract information, better understand the data, and make more effective decisions.
You can take Visualizing Data with Python certificate course on EDX.

14. Big Data: Data Visualisation - Online Course
A data visualization course is vital in bridging the gap between data and decisions. Discover the methods, tools, and processes involved.
- Course rating: 45,739 total enrollments
- Duration: 6 Hours
- Certificate: Certificate of completion
With this Data Visualization course, you will:
- Explore big data frameworks
- Demonstrate an integrated approach to big data
- Develop an awareness of how to participate effectively in a team working with big data experts
A data visualization course is an important visual method for effective communication and analyzing large datasets. Through data visualizations, we are able to draw conclusions from data that are sometimes not immediately obvious and interact with the data in an entirely different way.
This Data Visualization course will provide you with an informative introduction to the methods, tools, and processes involved in visualizing big data. We will also take the time to examine briefly the use of visualization throughout history dating back as far as 17000 BC.
We will use a variety of tools so that you become comfortable engaging with different software and confident trialing new packages to find those that best meet your needs. Please review the product websites below to ensure your system meets the minimum requirements for the tools we will be using.
- Tableau: You can use the free trial for a period of 2 weeks. Please do not start the trial until you are ready to do the Tableau exercises.
- MATLAB Online: MathWorks will provide you with a license to use MATLAB online for the duration of the course.
- D3.js: The D3 JavaScript library is available under the BSD license.
You can still learn effectively even if you don’t have access to all of these tools as you will be able to see what they can do for you.
You can take Big Data: Data Visualisation - Online Course Certificate Course on Futurelearn.

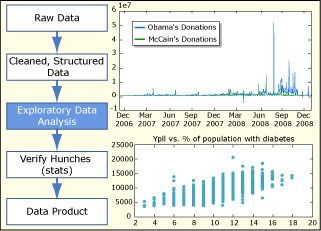
15. How to Process, Analyze and Visualize Data
This Data Visualization course is an introduction to data cleaning, analysis, and visualization. We will teach the basics of data analysis through concrete examples. You will learn how to take raw data, extract meaningful information, use statistical tools, and make visualizations.
This was offered as a non-credit course during the Independent Activities Period (IAP), which is a special 4-week term at MIT that runs from the first week of January until the end of the month.
You can still learn effectively even if you don’t have access to all of these tools as you will be able to see what they can do for you.
You can take the How to Process, Analyze and Visualize Data Certificate Course on MIT OpenCourseWare.
Hey! If you have made it this far then certainly you are willing to learn more and here at Coursesity, it is our duty to enlighten people with knowledge on topics they are willing to learn. Here are some more topics that we think will be interesting for you!